| When | Normal | Prediabetes | Diabetes |
|---|---|---|---|
| Fasting (8h, no food) | under 100 mg/dL | 100–125 | 126 or higher |
| 2 hours after eating | under 140 mg/dL | 140–199 | 200 or higher |
| Random, any time | under 140 mg/dL | — | 200+ with symptoms |
| A1C | under 5.7% | 5.7–6.4% | 6.5% or higher |
In mmol/L (divide mg/dL by 18):
| When | Normal | Prediabetes | Diabetes |
|---|---|---|---|
| Fasting | under 5.6 | 5.6–6.9 | 7.0 or higher |
| 2 hours after eating | under 7.8 | 7.8–11.0 | 11.1 or higher |
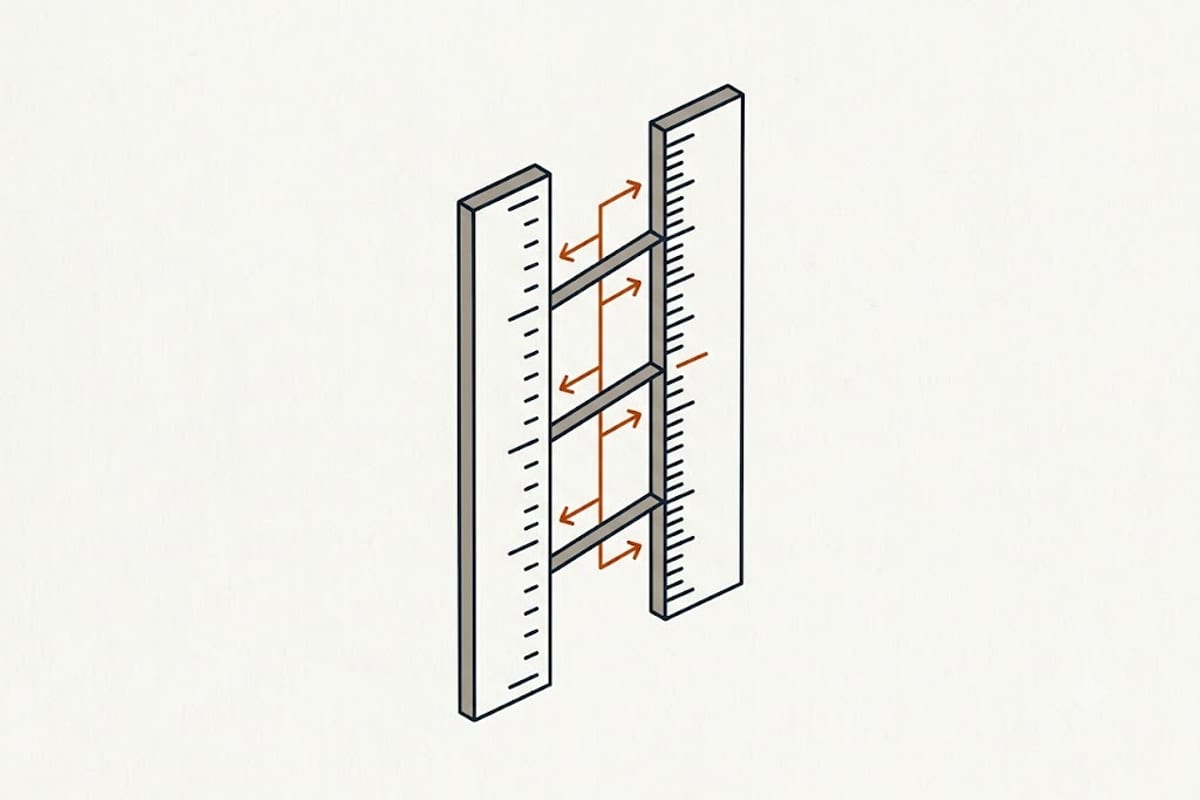
The number only means something with a timestamp
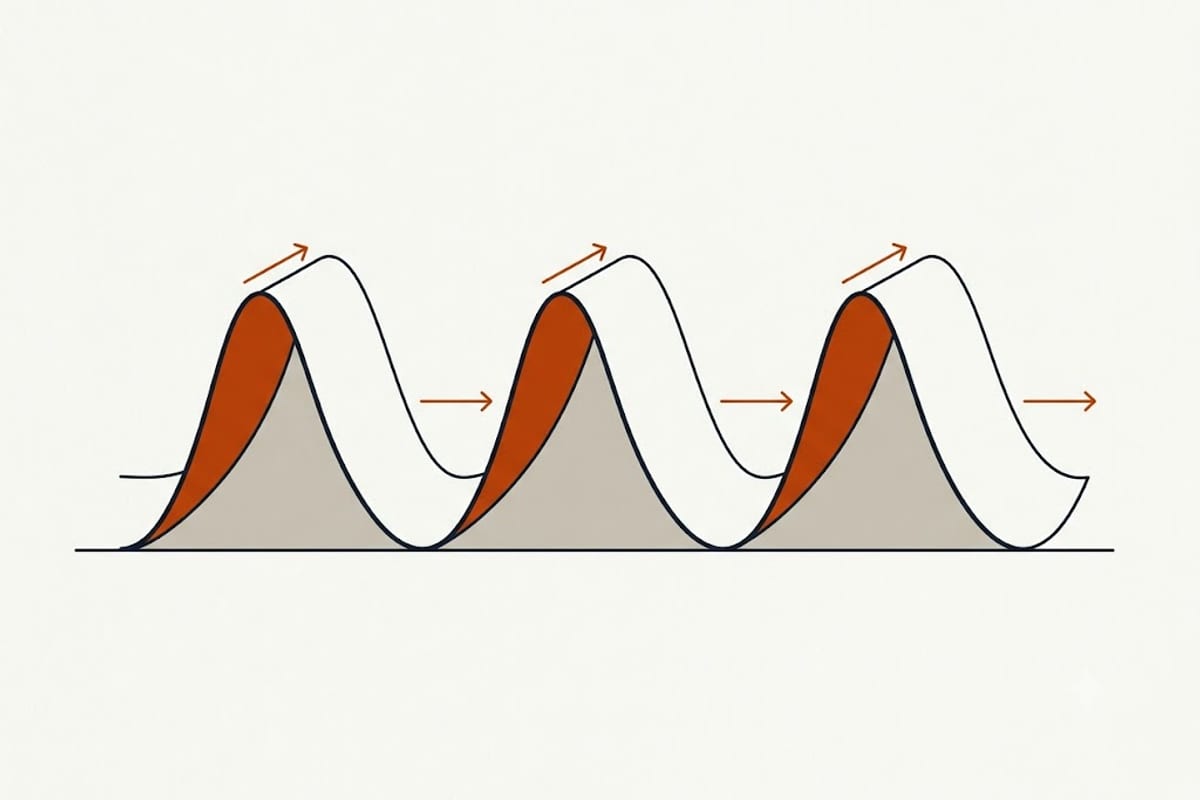
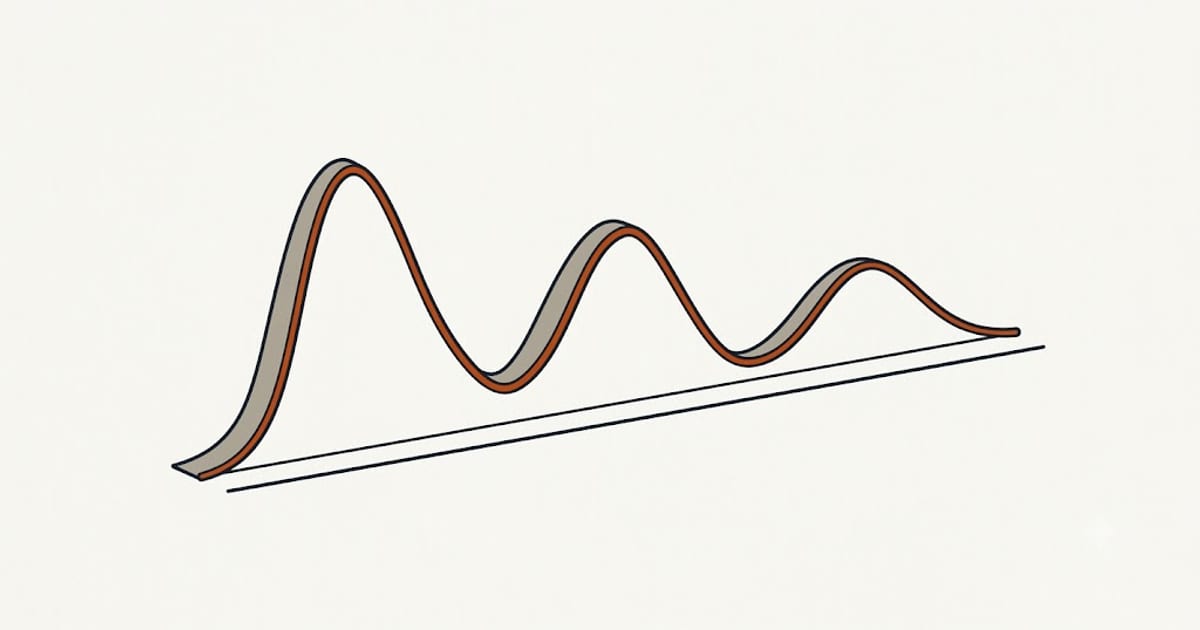
Blood glucose is not a fixed property. It rises after eating, peaks somewhere around 30 to 90 minutes later depending on the meal, and returns toward baseline over two to three hours.
A reading of 140 mg/dL is normal 45 minutes after a meal and abnormal after an overnight fast. Any glucose figure without a time relative to eating is uninterpretable, which is why every row of the table above names one.
Fasting means at least 8 hours with nothing but water. Coffee with milk breaks it.
Where the thresholds come from
They are diagnostic cut-offs set by the American Diabetes Association, not laboratory reference intervals. Someone drew a line across a continuous scale where outcome data supported drawing it.
That is why 125 and 126 mg/dL are not meaningfully different measurements — they are on either side of an administrative boundary. A diagnosis normally requires two abnormal results, or one plus a confirming test on a different day.
A1C and daily readings answer different questions
A1C reflects average exposure over roughly three months, weighted toward the recent past. A fingerstick reflects this moment.
They can disagree without either being wrong. An A1C of 6.2% converts to an estimated average of 131 mg/dL, and a morning fasting reading of 105 alongside it is entirely consistent — fasting glucose is normally the lowest point of the day.
An A1C also averages away variability: 6.2% is compatible with steady readings near 130 and with swings between 70 and 200. That gap is why continuous monitoring reports time in range alongside average, and it is the main limitation of any single summary number.
Low readings
Below 70 mg/dL (3.9 mmol/L) is hypoglycaemia and matters more urgently than a high reading, particularly for anyone on insulin or sulfonylureas.
Symptoms — shakiness, sweating, confusion, hunger — are the signal rather than the number, and they are treated with fast-acting carbohydrate before anything else.
Testing at home, and what to test
For anyone without diabetes there is no routine reason to test at home. For anyone with it, the useful pattern is set by the clinician and usually pairs readings — before a meal and two hours after — so that the effect of the meal is visible rather than a single unanchored number.
Testing at the same times on different days makes a trend readable. Testing at random times produces a scatter that cannot be compared with anything, including itself.
Continuous glucose monitors changed this by removing the sampling problem entirely, and their headline output is not an average at all but time in range — the share of the day spent between roughly 70 and 180 mg/dL. Two people with identical A1C can have very different time in range, and the second number is the more informative of the two.
What moves a reading
Illness and infection raise it. Stress raises it. Steroids raise it substantially. Poor sleep raises it. Exercise usually lowers it, though brief intense exercise can raise it temporarily.
Meter accuracy is also part of the picture: home glucose meters are permitted a margin of roughly 15%, so a reading of 100 could represent 85 to 115. That margin is fine for tracking a trend and too wide to hang a decision on a single point.
Sources: American Diabetes Association Standards of Care in Diabetes, diagnostic criteria; NIDDK Diabetes Tests & Diagnosis.
Reference thresholds reproduced for general information. Not medical advice. Any result belongs with the clinician who ordered it.