Unit Conversions
mg/dL to mmol/L and the rest of the everyday set.
There is no single conversion between mg/dL and mmol/L. The factor depends on what is being measured, and that is worth thirty seconds of explanation because it prevents a whole class of error.
mg/dL is a mass per volume. mmol/L is a count of molecules per volume. Converting between them means dividing by the molecular weight of the substance. Glucose is 180 g/mol, so mg/dL ÷ 18 gives mmol/L. Cholesterol is a far heavier molecule at 386.7 g/mol, hence ÷ 38.67. Triglycerides are heavier still at ÷ 88.57.
The molar unit is the more informative one for chemistry, since it counts the particles doing the work. The mass unit is the older convention and remains standard in the United States, while most of the rest of the world reports in mmol/L.
Round numbers in one system are awkward in the other
A fasting glucose threshold of 126 mg/dL is 7.0 mmol/L. An upper normal of 100 mg/dL is 5.6. "Under 7" and "under 126" are the same clinical target expressed twice, which is why guidelines from different countries can look like they disagree when they do not.
For the mental version: mmol/L × 18 ≈ mg/dL.
A1C conversion is not a unit conversion
The A1C-to-estimated-average-glucose relationship is an empirical fit from the ADAG study, not a change of units:
eAG (mg/dL) = 28.7 × A1C − 46.7
It exists so a percentage can be compared with the numbers on a home meter. It is an estimate of an average, not a prediction of any individual reading — a morning fingerstick of 105 alongside an A1C of 6.2% is not a contradiction, because fasting glucose is normally the lowest reading of the day.
Converting a value does not convert its interpretation
The reference range printed beside a result comes from the laboratory that ran it, and ranges differ between labs because assays and populations differ.
A converted number compared against a range from a different laboratory is two sources of error stacked. Where a result matters, compare it with the range on the same report.
Numbers of similar size in different units
Cholesterol of 6.2 mmol/L and an A1C of 6.2% share a number and nothing else. Reading a printout value by value with its unit attached, rather than scanning for figures, is the habit that prevents this.
Sources: Clinical Chemistry SI unit conversion tables; American Diabetes Association Standards of Care in Diabetes; National Institutes of Health laboratory reference material.
Reference tables for general information, not medical advice. Interpret any result with the reference range on the report and with the clinician who ordered it.
5 articles
 BMI — The Formula, the Categories, and Four Things It Cannot See
A single ratio of two measurements cannot distinguish muscle from fat, and it was never intended to.
 Pounds to Kilograms for Dosing: Divide by 2.2, and Never Round Up
Divide by 2.2. The arithmetic is trivial; the part worth knowing is which direction to round when the answer lands between two lines on a chart.
 Lab Unit Conversion Chart: Conventional to SI for Common Blood Tests
Every analyte has its own factor because every molecule has its own weight. One universal converter does not exist and any page offering one is wrong.
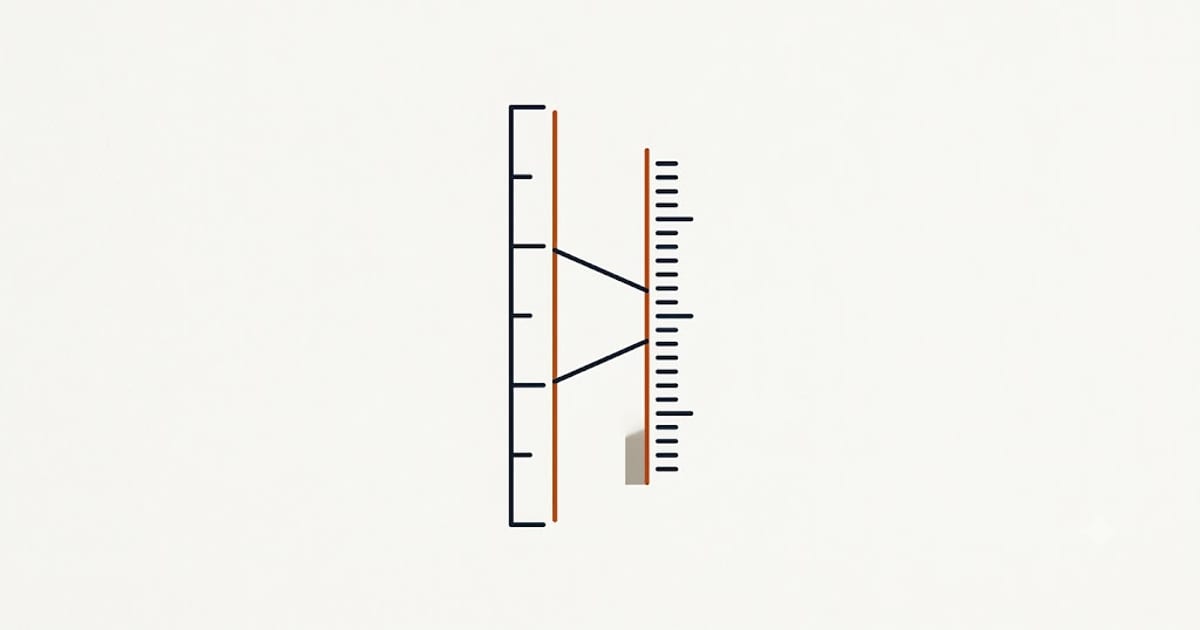 mg/dL to mmol/L: Divide Glucose by 18 — But Every Analyte Has Its Own Divisor
There is no single mg/dL to mmol/L conversion. The factor depends on the molecular weight of what is being measured, which is why cholesterol and glucose do not share one.
 Celsius to Fahrenheit for Body Temperature: The Chart and the Arithmetic
The full formula works everywhere. Near body temperature there is a shortcut accurate to a tenth of a degree, which is all a thermometer offers anyway.