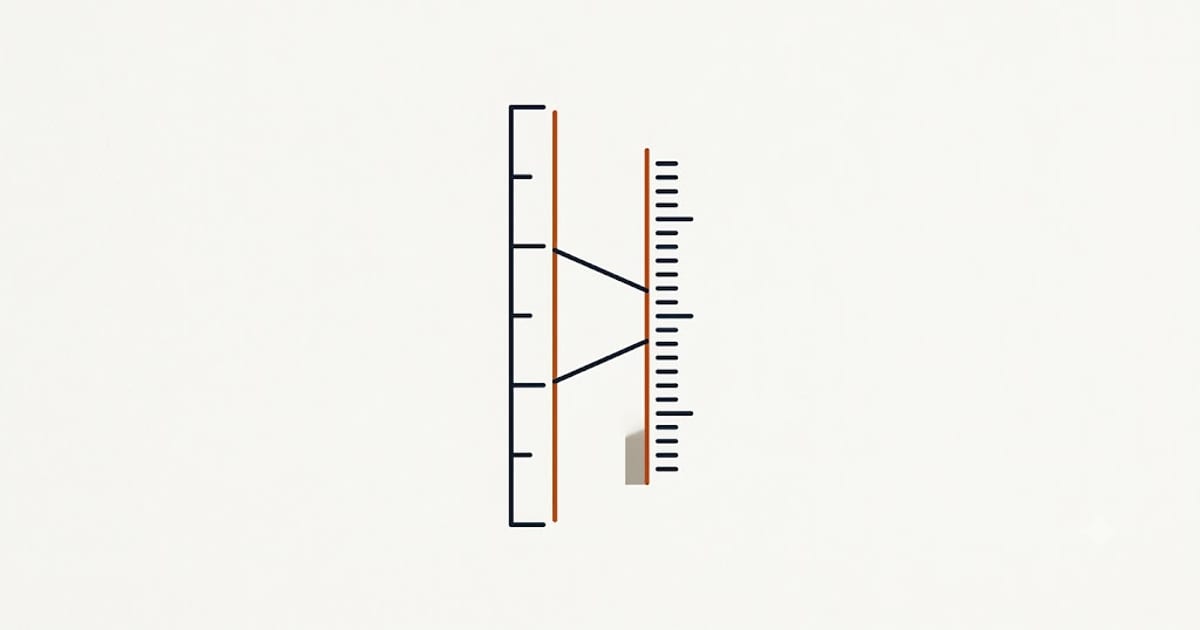
Glucose: divide mg/dL by 18 to get mmol/L. Multiply by 18 to go back.
That factor is for glucose only. Ask the same question about cholesterol and the answer is 38.67. There is no universal conversion, and the reason is worth thirty seconds.
The conversion factors
| Analyte | mg/dL → mmol/L | mmol/L → mg/dL |
|---|---|---|
| Glucose | ÷ 18.0 | × 18.0 |
| Total cholesterol, LDL, HDL | ÷ 38.67 | × 38.67 |
| Triglycerides | ÷ 88.57 | × 88.57 |
| Urea (BUN) | ÷ 2.80 | × 2.80 |
| Creatinine (to µmol/L) | × 88.4 | ÷ 88.4 |
| Calcium | ÷ 4.0 | × 4.0 |
| Bilirubin (to µmol/L) | × 17.1 | ÷ 17.1 |
| Uric acid | ÷ 16.81 | × 16.81 |
Why the factors differ
mg/dL is a mass per volume. mmol/L is a count of molecules per volume.
Converting between them means dividing mass by the mass of one mole of the substance — its molecular weight. Glucose is 180 g/mol, so mg/dL ÷ 18 gives mmol/L after the decilitre-to-litre adjustment. Cholesterol is a much heavier molecule at 386.7 g/mol, hence 38.67. Triglycerides are heavier still.
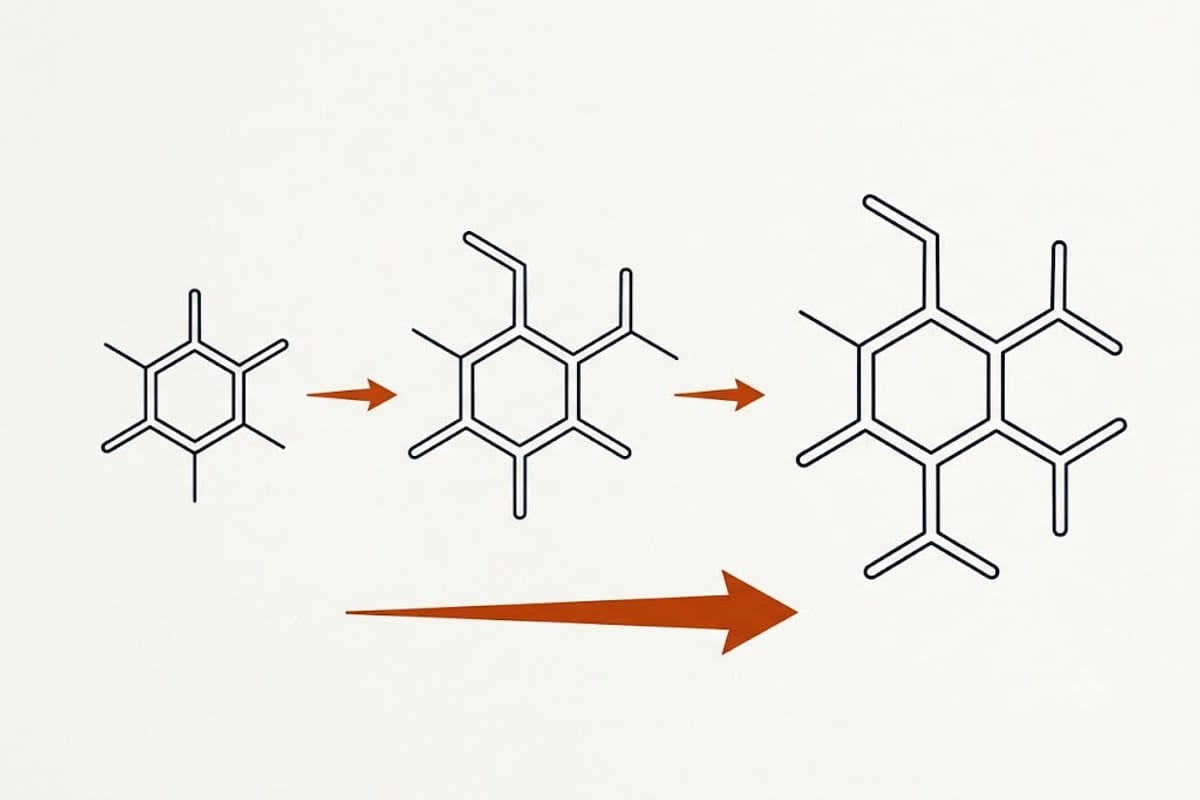
The molar unit is the more informative one for chemistry — it counts the particles doing the work. The mass unit is the older convention and remains standard in the United States. Most of the rest of the world reports in mmol/L.
Glucose, both ways
| mg/dL | mmol/L | |
|---|---|---|
| 70 | 3.9 | Low end of normal fasting |
| 90 | 5.0 | |
| 100 | 5.6 | Upper normal fasting |
| 126 | 7.0 | Diabetes diagnostic threshold, fasting |
| 140 | 7.8 | Upper normal, 2 hours post-meal |
| 180 | 10.0 | |
| 200 | 11.1 | Diabetes threshold, random or 2-hour |
| 300 | 16.7 |
The round numbers in each column are round in one system and awkward in the other. "Under 7" and "under 126" are the same clinical target expressed twice, which is why guidelines from different countries can look like they disagree when they do not.
For the mental version: mmol/L × 18 ≈ mg/dL, and in the other direction, halving and then dividing by 9 gets close enough to read a chart.
Cholesterol, both ways
| mg/dL | mmol/L |
|---|---|
| 100 (LDL target) | 2.6 |
| 130 | 3.4 |
| 160 | 4.1 |
| 200 (total, upper desirable) | 5.2 |
| 240 (total, high) | 6.2 |
Note how close 6.2 mmol/L total cholesterol looks to an A1C of 6.2%. Nothing connects them. Lab numbers of similar magnitude in different units are one of the easier ways to misread a printout, and it is why every value should be read together with its unit rather than as a bare number.

Reference ranges are not conversions
Converting a value does not convert its interpretation. The reference range printed beside a result comes from the laboratory that ran it, and ranges differ between labs because assays and populations differ.
A converted number compared against a range from a different laboratory is two sources of error stacked. Where a result matters, compare it with the range on the same report.
Glucose has a second layer on top of this: A1C converts to an average glucose through its own formula, which is not a unit conversion at all but an empirical fit. Vitals sit outside this entirely, on fixed categories rather than reference intervals.
Sources: Clinical Chemistry SI unit conversion tables; American Diabetes Association Standards of Care in Diabetes diagnostic thresholds; National Institutes of Health laboratory reference material.
Reference tables for general information, not medical advice. Interpret any result with the reference range on the report and with the clinician who ordered it.